Thanks to Luke J Byrne for the Repository! This is my fork of the original repository for my own learning and reference. Please check out his YouTube video for a detailed walkthrough of the project.
This project is a data engineering pipeline solution to a made-up business problem, created to aid in my learning and understanding of data pipelining.
In this project, your company has recognized a gap in understanding its customer demographics—specifically, the gender distribution within the customer base and how it might influence product purchases. With a significant amount of customer data stored in an on-premises SQL database, key stakeholders have requested a comprehensive KPI dashboard. This dashboard should provide insights into sales by gender and product category, showing total products sold, total sales revenue, and a clear gender split among customers. Additionally, they need the ability to filter this data by product category and gender, with a user-friendly interface for date-based queries.
This project addresses a critical business need by building a comprehensive data pipeline on Azure. The goal is to extract customer and sales data from an on-premises SQL database, transform it in the cloud, and generate actionable insights through a Power BI dashboard. The dashboard will highlight key performance indicators (KPIs) related to gender distribution and product category sales, allowing stakeholders to filter and analyze data by date, product category, and gender.
The business has identified a gap in understanding customer demographics—specifically gender distribution—and how it influences product purchases. The key requirements include:
- Sales by Gender and Product Category: A dashboard showing the total products sold, total sales revenue, and a gender split among customers.
- Data Filtering: Ability to filter the data by product category, gender, and date.
- User-Friendly Interface: Stakeholders should have access to an easy-to-use interface for making queries.
To address this request, we'll build a robust data pipeline that extracts the on-premises data, loads it into Azure, and performs the necessary transformations to make the data more query-friendly. The transformed data will then feed into a custom-built report that meets all the specified requirements. This pipeline will be scheduled to run automatically every day, ensuring that stakeholders always have access to up-to-date and accurate data.
To meet these requirements, the solution is broken down into the following components:
-
Data Ingestion:
- Extract customer and sales data from an on-premises SQL database.
- Load the data into Azure Data Lake Storage (ADLS) using Azure Data Factory (ADF).
-
Data Transformation:
- Use Azure Databricks to clean and transform the data.
- Organize the data into Bronze, Silver, and Gold layers for raw, cleansed, and aggregated data respectively.
-
Data Loading and Reporting:
- Load the transformed data into Azure Synapse Analytics.
- Build a Power BI dashboard to visualize the data, allowing stakeholders to explore sales and demographic insights.
-
Automation:
- Schedule the pipeline to run daily, ensuring that the data and reports are always up-to-date.
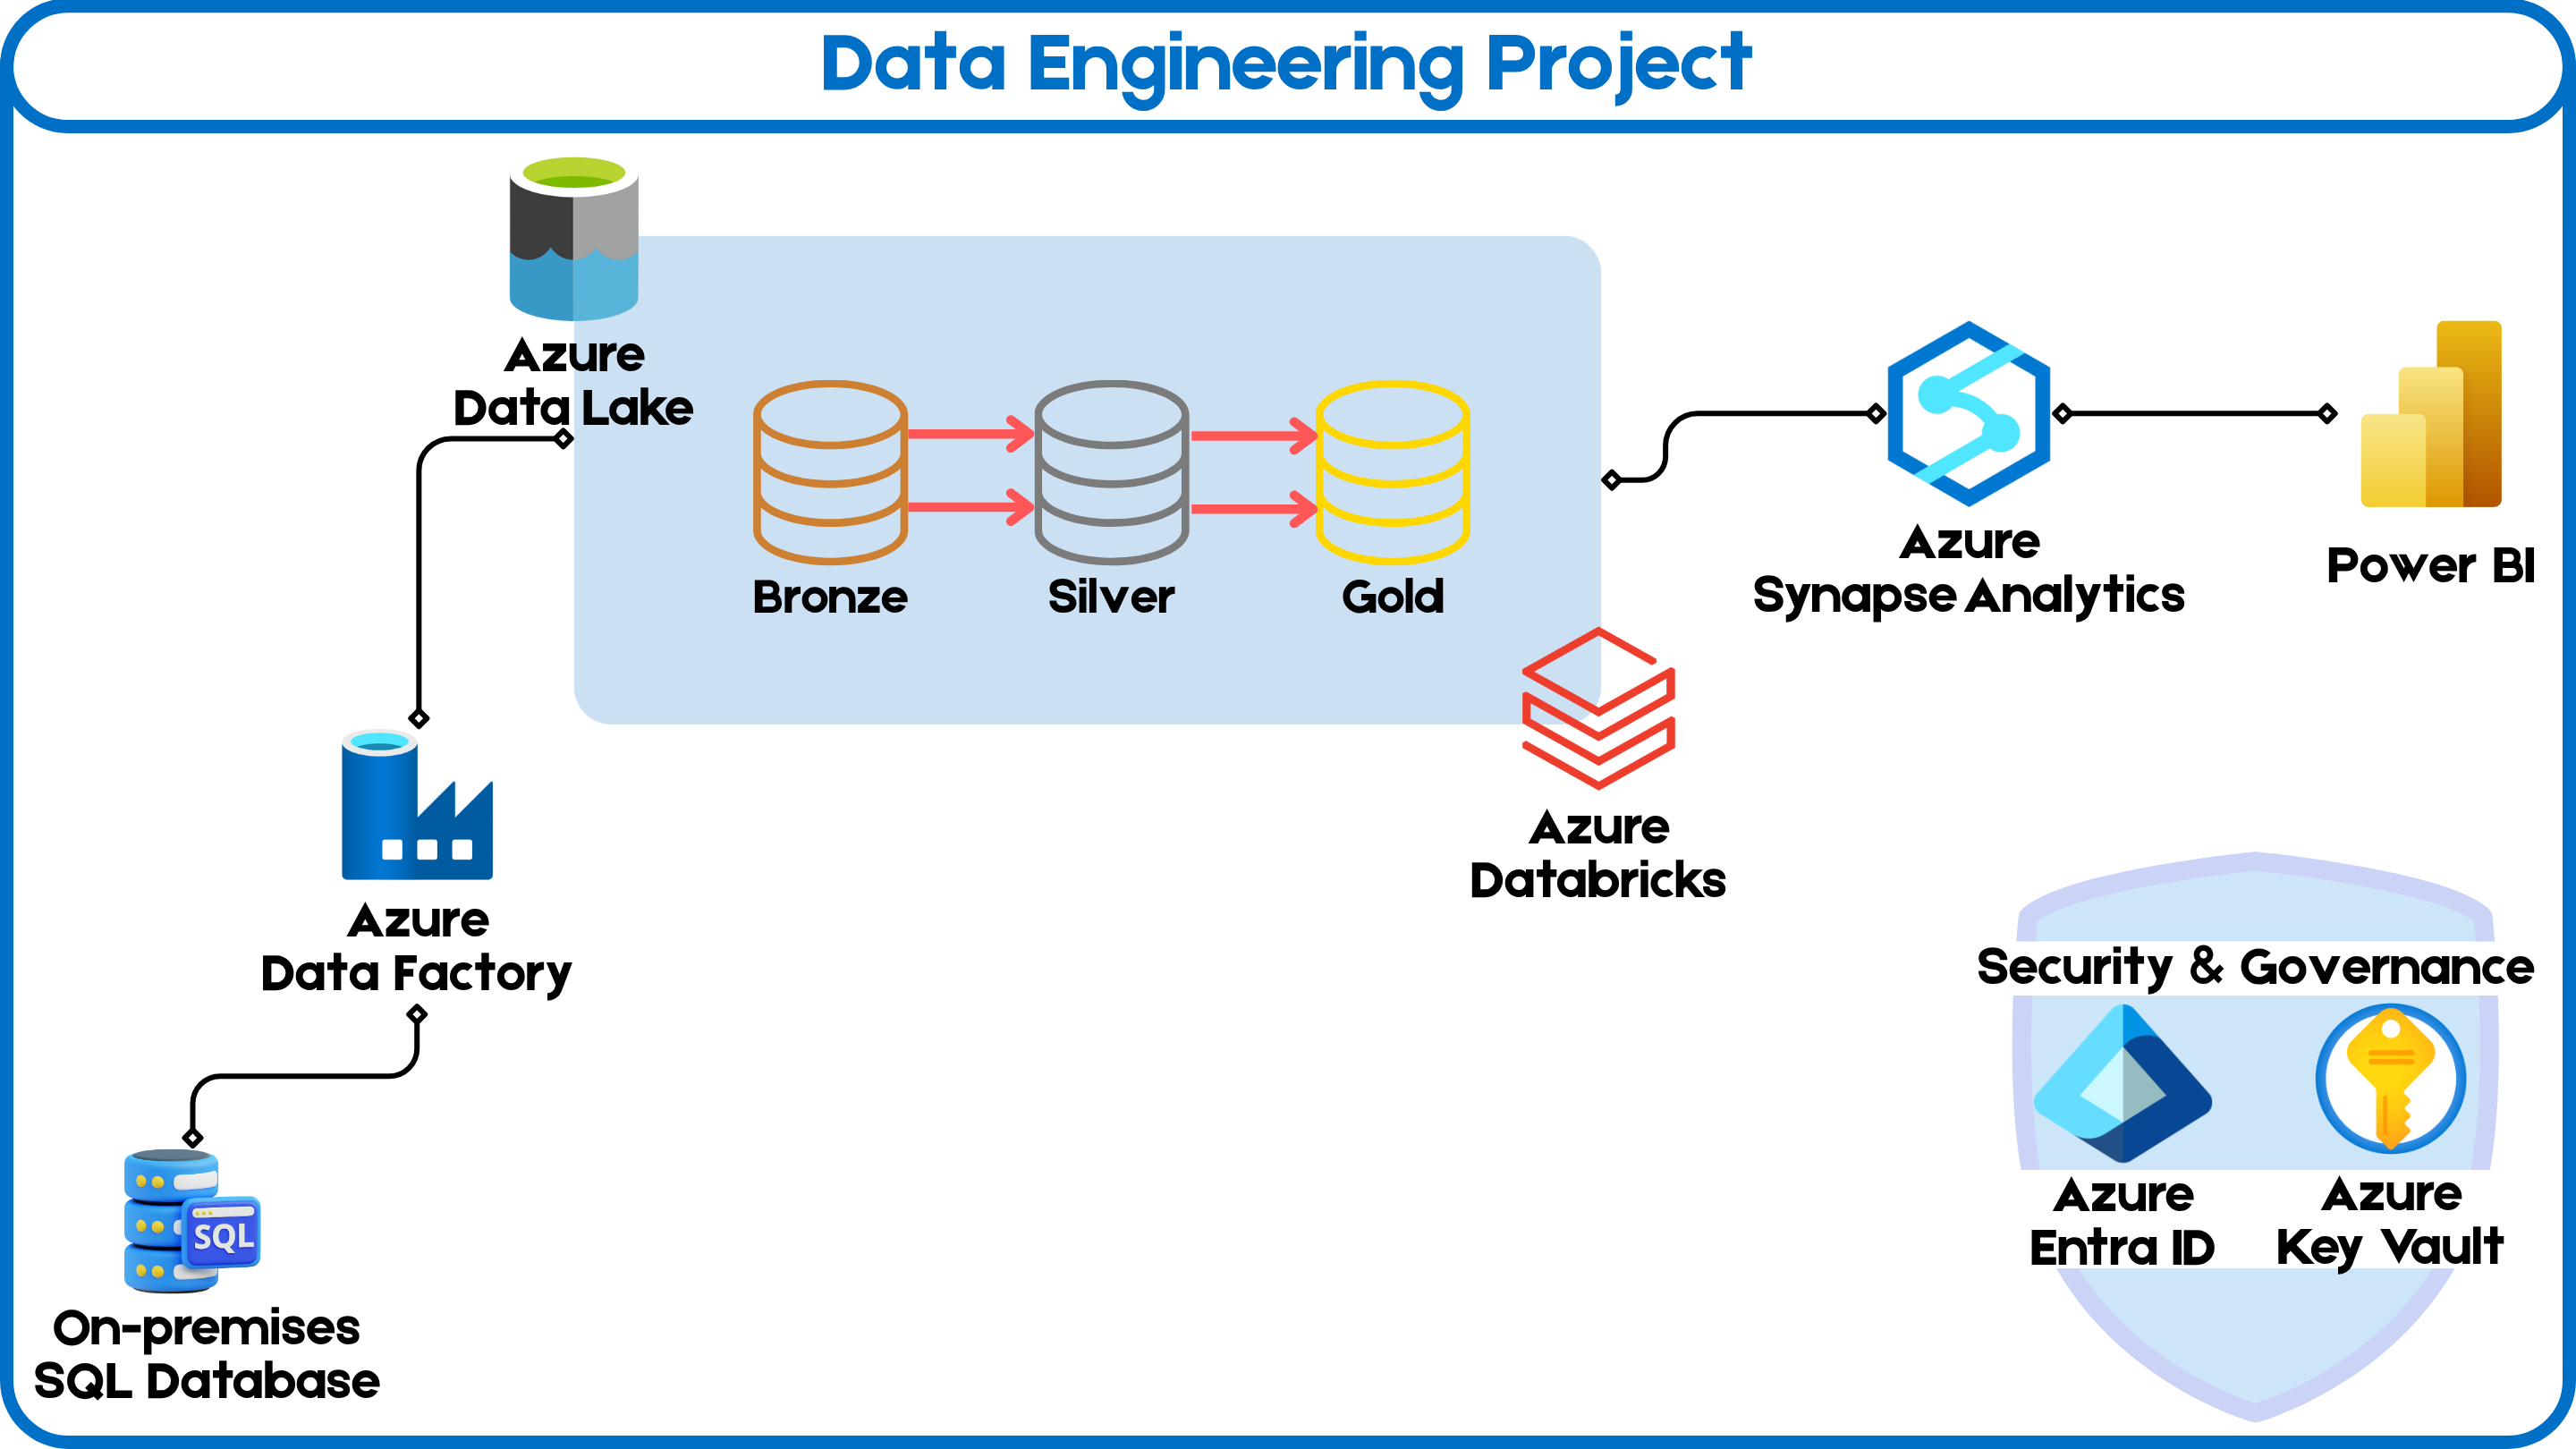
- Azure Data Factory (ADF): For orchestrating data movement and transformation.
- Azure Data Lake Storage (ADLS): For storing raw and processed data.
- Azure Databricks: For data transformation and processing.
- Azure Synapse Analytics: For data warehousing and SQL-based analytics.
- Power BI: For data visualization and reporting.
- Azure Key Vault: For securely managing credentials and secrets.
- SQL Server (On-Premises): Source of customer and sales data.
- An Azure account with sufficient credits.
- Access to an on-premises SQL Server database.
- Create Resource Group: Set up a new resource group in Azure.
- Provision Services:
- Create an Azure Data Factory instance.
- Set up Azure Data Lake Storage with
bronze,silver, andgoldcontainers. - Set up an Azure Databricks workspace and Synapse Analytics workspace.
- Configure Azure Key Vault for secret management.
- Set up SQL Server: Install SQL Server and SQL Server Management Studio (SSMS). Restore the AdventureWorks database.
- Ingest Data with ADF: Create pipelines in ADF to copy data from SQL Server to the
bronzelayer in ADLS.
- Mount Data Lake in Databricks: Configure Databricks to access ADLS.
- Transform Data: Use Databricks notebooks to clean and aggregate the data, moving it from
bronzetosilverand then togold.
- Load Data into Synapse: Set up a Synapse SQL pool and load the
golddata for analysis. - Create Power BI Dashboard: Connect Power BI to Synapse and create visualizations based on business requirements.
- Schedule Pipelines: Use ADF to schedule the data pipelines to run daily.
- Monitor Pipeline Runs: Use the monitoring tools in ADF and Synapse to ensure successful pipeline execution.
- Manage Access: Set up role-based access control (RBAC) using Azure Entra ID (formerly Active Directory).
- Trigger and Test Pipelines: Insert new records into the SQL database and verify that the entire pipeline runs successfully, updating the Power BI dashboard.
This project provides a robust end-to-end solution for understanding customer demographics and their impact on sales. The automated data pipeline ensures that stakeholders always have access to the most current and actionable insights.
I added a file called 'steps.md' to the repository, which contains a detailed step-by-step guide from the YouTube video for setting up the project. This guide is designed to help me replicate the project on my own Azure environment.