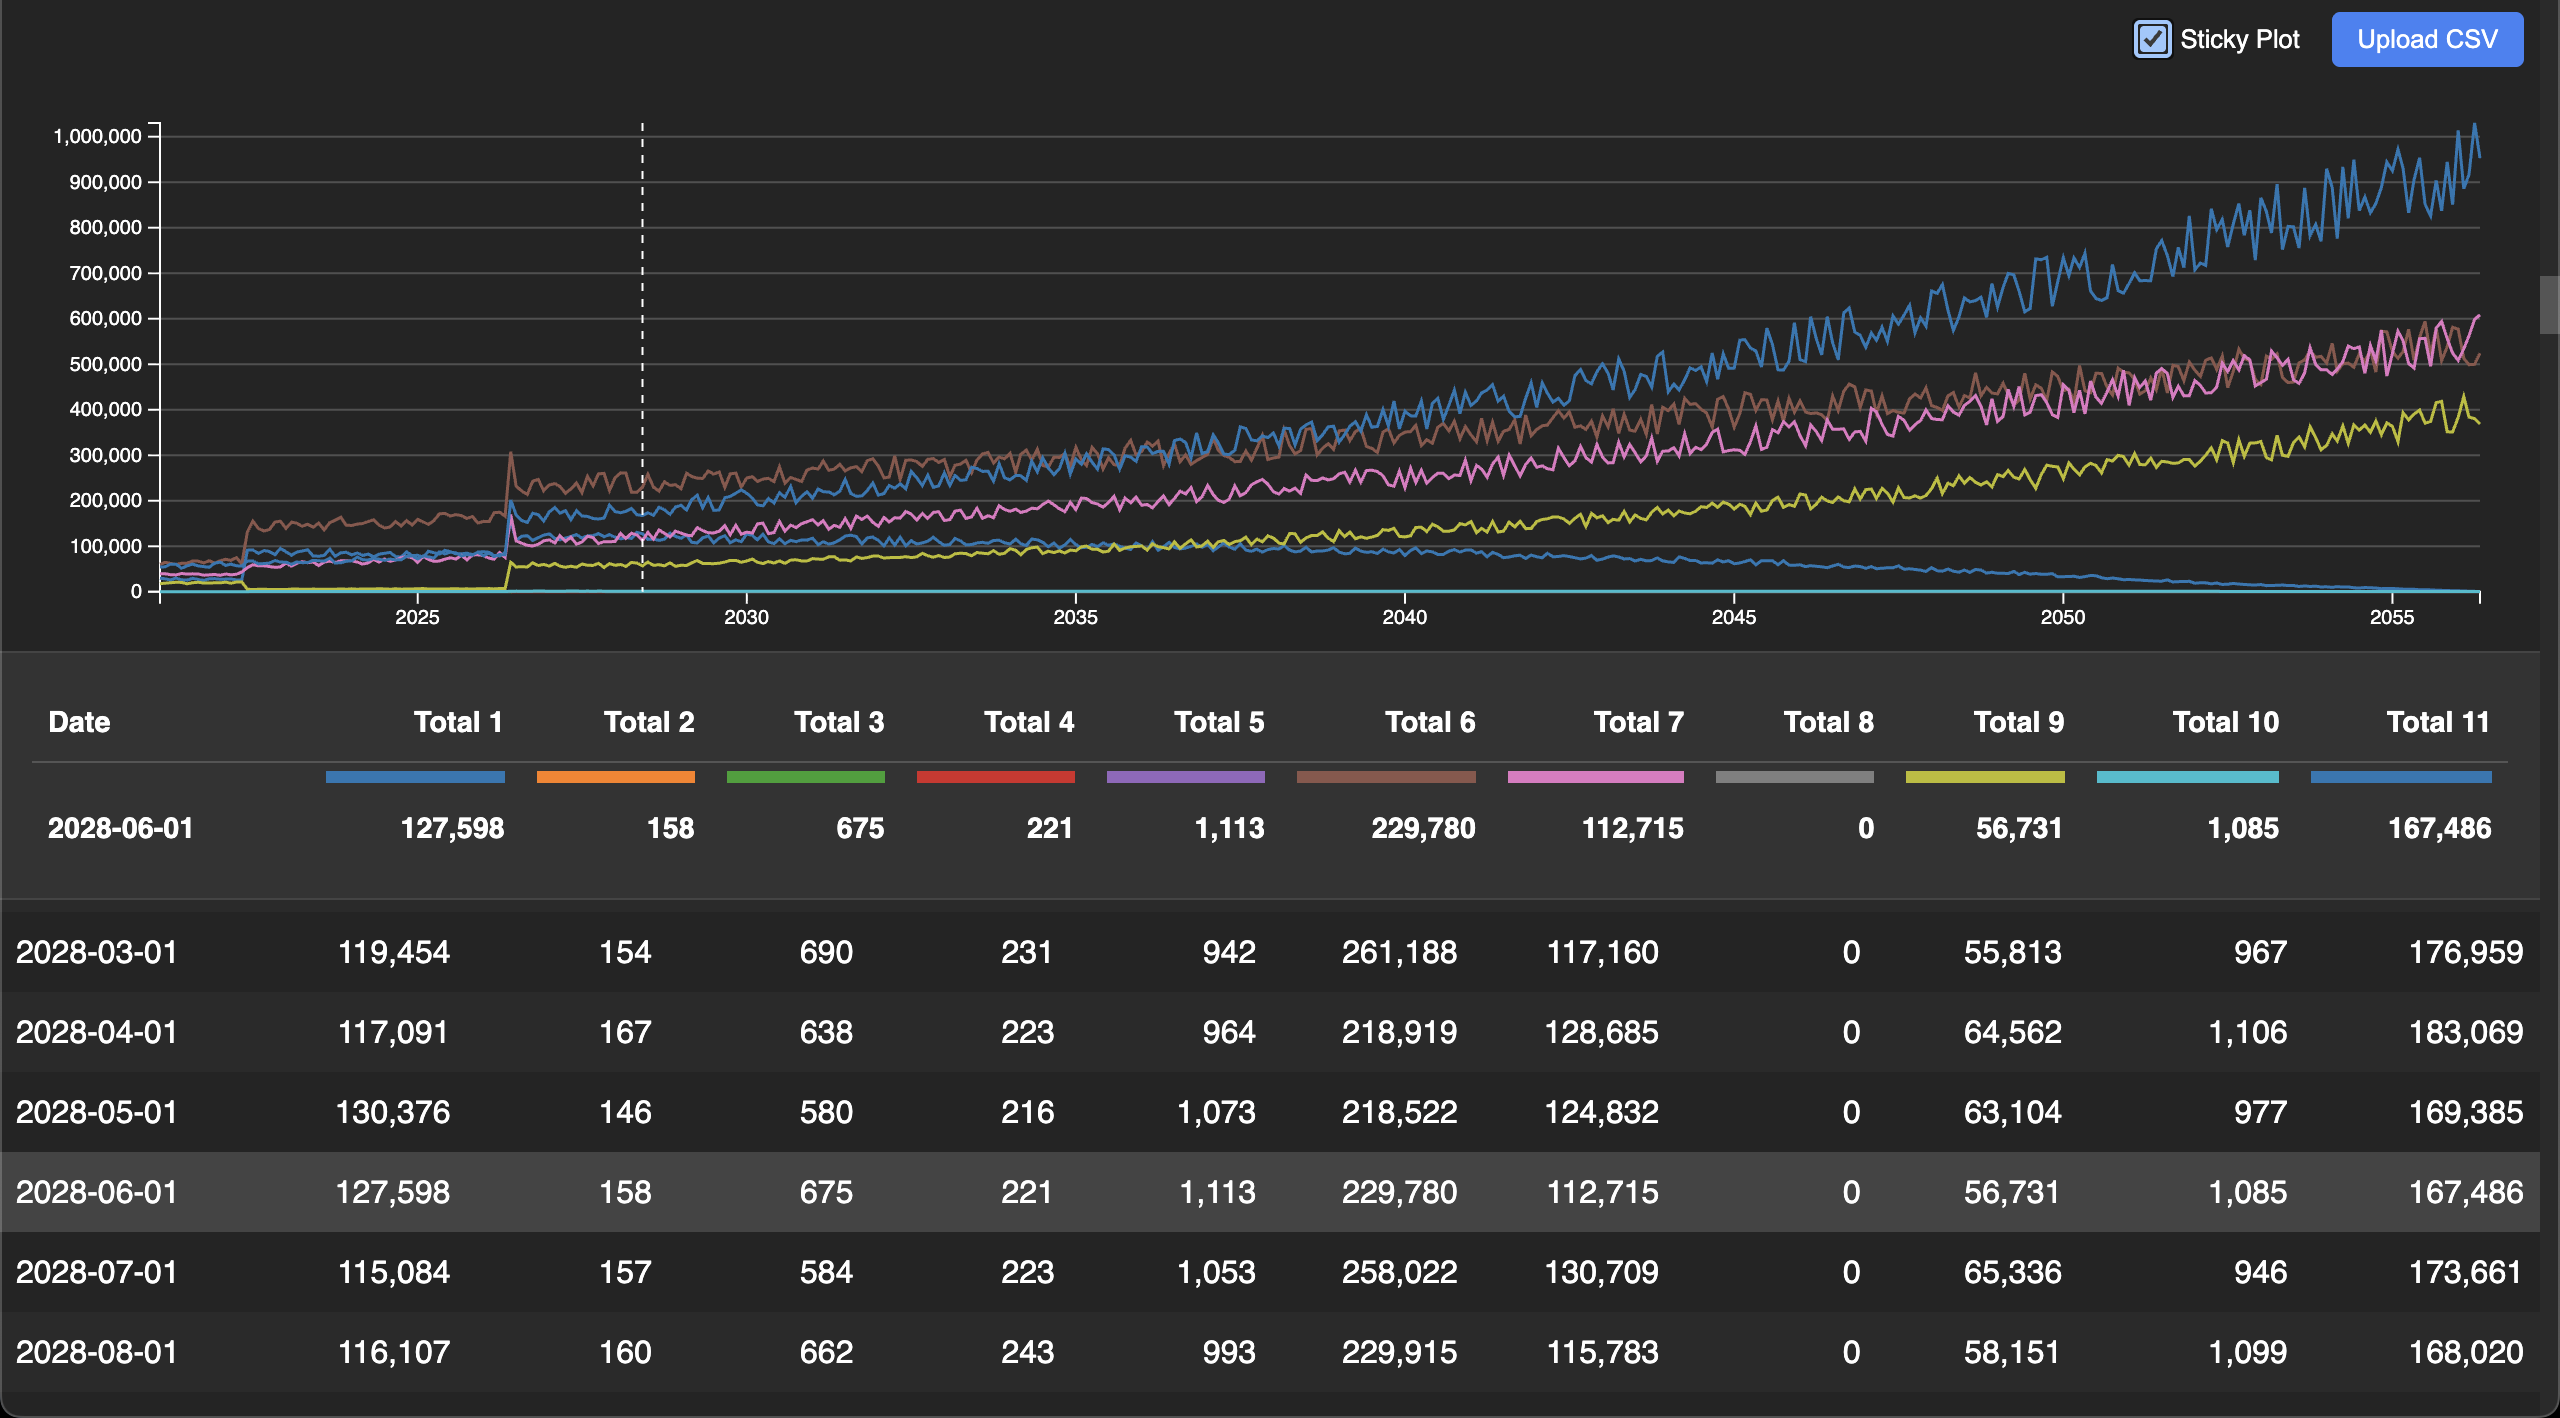
Tool + app for visualizing time series data.
Visit https://aaronstacy.com/plottimeseries
You can pass a CSV file as a query parameter like this.
You can also upload a CSV file using the button in the upper right corner.
- Clone this repository
- Install dependencies:
npm install - Build the assets:
npm run build path/to/your/file.csv > index.html - Open
index.htmlin a web browser
Do whatever is in .github/workflows/ci.yml, but roughly:
npm installnpm run dev- Open
http://localhost:3000in a web browser
To validate changes:
npm run lintnpm run typechecknpm run testmkdir -p pages-public && npm run build public/data.csv > pages-public/index.html
This is an attempt at using AI, generated with Google's Antigravity.
DESIGN.md was mostly generated from an initial simple prompt:
Create a README.md to design a node.js project that plots time series data from csv input. Use React for all UI, d3.js for all visualizations. Provide a hot-reloading development server that plots csv data from a local development directory in this repository, and provide a single file javascript utility that can be run via node.js that can take a csv file as input and generate the same output as the development server.
The UI was remarkably easy to generate. The logic to make it work either as a CLI or as a web site, and then to get tests and deployment to work on every change was surprisingly manual.