

Whole slide image (WSI) tiling: tissue detection, artifact removal and square or hexagonal tile grids, on top of OpenSlide or FastSlide.
Many excellent tools already tile WSIs, but most are part of larger frameworks that are heavy to install and hard to navigate when all you need is tiling. patchology is a lightweight, standalone library focused on two things: fast tiling and broad WSI format support.
Warning
For research use only. patchology is not a medical device and is not validated for clinical diagnosis.
Requires Python 3.12+. Both slide backends, OpenSlide and FastSlide, are
installed with patchology (OpenSlide's binaries come with openslide-bin, so
no system package is needed).
pip install patchologyFor development, install from a clone in editable mode, so a git pull takes
effect without reinstalling:
git clone https://github.com/twpkevin06222/patchology.git
cd patchology
pip install -e .The standard openslide-bin from PyPI works for most formats. For PreciPoint
VMIC (.vmic) support and fixes for Ventana BIF and DICOM, build the patched
OpenSlide from the dev branch of
twpkevin06222/openslide and install
its wheel over the standard one (Linux; needs the build dependencies listed in
that repo):
git clone -b dev https://github.com/twpkevin06222/openslide
cd openslide/packaging
./build-wheel.sh
pip install --force-reinstall wheelhouse/openslide_bin-*.whlfrom patchology import ArtifactConfig, TilingConfig, TilingPipeline, open_slide
pipeline = TilingPipeline(
tiling=TilingConfig(tile_size=224, tile_mpp=0.5, tile_overlap=0.2, grid="hex"),
artifacts=ArtifactConfig(pen=True, blur=True),
)
with open_slide("slide.svs", backend="fastslide") as slide:
result = pipeline.run(slide)
result.save("out/slide") # tiles.csv, metadata.json, tissue_mask.png, overlay.png
for (x, y), tile in result.iter_tiles(slide):
... # tile: (224, 224, 3) uint8 RGBOr as a generator that owns the slide and exposes its properties and masks:
from patchology import ColorConfig, TileGenerator

with TileGenerator("slide.svs", color=ColorConfig(stain_normalization="macenko")) as gen:
    gen.properties, gen.dimensions, gen.mpp, gen.icc_profile  # no tiling needed
    gen.tissue_mask, gen.artifact_mask, gen.coords, gen.source_stains  # computed in __init__
    for (x, y), tile in gen:  # tissue -> artifacts -> tiles -> ICC (opt-in) -> stain norm
        ...
ROI tiling: pass roi= a GeoJSON file (e.g. a QuPath export, level-0 pixel
coordinates) or a folder holding one GeoJSON whose name contains the slide
name. Only tissue inside the ROI is tiled. A file whose name does not contain
the slide name (whole token, so sample does not match sample-2) is
refused unless check_roi_name=False. roi_exclude_classes={"class01"} leaves
out objects of those annotation classes (QuPath classification names), e.g. to
tile only class02 and class03 from a segmentation annotation file.
with TileGenerator("sample.svs", roi="sample.svs_roi_annotations.geojson") as gen:
    for (x, y), tile in gen:
        ...
Segmentation tiles: SegmentationTileGenerator takes a GeoJSON ground truth
and yields ((x, y), tile, mask), with mask a (tile_size, tile_size) uint8
array aligned with the tile. With class_map (annotation class name to label,
with integer larger than 0 [default background label value]) each object is drawn with its class's label and objects of unmapped
classes are ignored; without it the mask is 0/1. A tile is kept if at least
object_mask_overlap (e.g. 0.2 = 20%) of it is ground truth; 0 keeps every
tissue tile, including empty masks. All TileGenerator options (ICC, stain
normalisation, roi=) apply.
from patchology import SegmentationTileGenerator

with SegmentationTileGenerator(
    "sample.svs",
    "sample.svs_annotations.geojson",
    object_mask_overlap=0.2,
    class_map={"class01": 1, "class02": 2, "class03": 3},
) as gen:
    for (x, y), tile, mask in gen:
        ...
Detection tiles: DetectionTileGenerator takes the same GeoJSON ground truth
and yields ((x, y), tile, target), with target =
{"boxes": (N, 4) float32, "labels": (N,) int64}: each object's bounding box in
COCO [x, y, width, height] tile pixels. An object cut by the tile edge is
kept (clipped) if at least min_box_visibility (e.g. 0.6 = 60%) of its box is
inside the tile, and a tile is kept if it has at least min_objects objects (0
keeps empty tissue tiles too, as negatives). class_map labels are integers
= 0 (default 1 for every object). With
roi_class, unannotated objects outside the annotated region must never count as background: by default tiles lie wholly inside it, and withroi_fill(an RGB colour) tiles only need to overlap it and pixels outside it are painted over, so regions smaller than a tile still give tiles (lowertiling.tissue_overlapfor very small regions).
from patchology import DetectionTileGenerator

with DetectionTileGenerator(
    "sample.svs",
    "sample.svs_annotations.geojson",  # ASAP XML: python -m patchology.utilities.xml_to_geojson
    min_box_visibility=0.6,
    min_objects=1,
    class_map={"class01": 1, "class02": 2},
    roi_class="roi",
    roi_fill=(255, 255, 255),  # paint outside the ROI white instead of skipping such tiles
) as gen:
    for (x, y), tile, target in gen:
        ...
GeoJSON format: ROI and ground-truth files are QuPath-style GeoJSON with
coordinates in level-0 (full resolution) pixels. See
src/patchology/references/sample.svs_annotations.geojson
for a complete example. A FeatureCollection (a single Feature, a list of
features or a bare geometry also work) of Polygon / MultiPolygon features;
the class is read from properties.classification.name, and other geometry
types (points, lines) are skipped with a warning:
{
  "type": "FeatureCollection",
  "features": [
    {
      "type": "Feature",
      "geometry": {
        "type": "Polygon",
        "coordinates": [[[22575, 31840], [22575, 31842], "...", [22575, 31840]]]
      },
      "properties": {
        "objectType": "annotation",
        "classification": {"name": "class02", "color": [37, 46, 201]}
      }
    }
  ]
}
The first ring of a polygon is its outline and any further rings are holes.
PyTorch: a generator is a map-style dataset (len, gen[i]), so wrap it in a
torch.utils.data.Dataset and use any num_workers; each worker reopens the
slide, and tiling runs once in the main process. With the fastslide backend,
start workers with multiprocessing_context="forkserver" (or "spawn"): FastSlide's
thread pool does not survive fork(), so forked workers raise instead of reading.
Read tiles with
gen.get_tile(i) (((x, y), tile), plus mask for segmentation),
gen.get_tile_at(x, y) (any level-0 coordinate) and gen.index_of(x, y).
class Tiles(torch.utils.data.Dataset):
    def __init__(self, gen):
        self.gen = gen

    def __len__(self):
        return len(self.gen)

    def __getitem__(self, i):
        (x, y), tile = self.gen[i]
        return torch.from_numpy(tile).permute(2, 0, 1), torch.tensor([x, y])


loader = DataLoader(Tiles(TileGenerator("slide.svs")), batch_size=32, num_workers=4)
Export tiles to QuPath: tiles_to_geojson(gen, "tiles.geojson", color=(0, 0, 0))
writes each tile as a level-0 bounding box (black by default); drag the file onto
the slide in QuPath to view it.
Or in one call: tile_slide("slide.svs", backend="openslide", tiling=TilingConfig(...)).
open_slide(path, backend="openslide" | "fastslide", fallback=True) returns a
SlideReader with the same interface as openslide.OpenSlide: dimensions,
level_count, level_dimensions, level_downsamples, properties (with
openslide.* keys), associated_images, read_region (level-0 location,
RGBA result, transparent outside the slide), get_thumbnail and
get_best_level_for_downsample.
If the preferred backend is not installed or cannot read the file, the other
one is tried. FastSlide's own metadata is kept under fastslide.* keys.
Extra helpers: mpp, bounds, read_region_rgb, read_region_scaled
(arbitrary downsample from the nearest level) and read_at_downsample.
As reported by the patched openslide-bin 4.0.0+vmic.1 (its built-in drivers;
see Patched OpenSlide) and FastSlide 0.8.1
(fastslide.get_supported_extensions()). Only Aperio .svs has been
tested with patchology.
| Format | Extension | OpenSlide | FastSlide |
|---|---|---|---|
| Aperio | .svs, .tif |
✅ | ✅ |
| Hamamatsu NDPI | .ndpi |
✅ | ✅ |
| Hamamatsu VMS / VMU | .vms, .vmu |
✅ | ❌ |
| 3DHISTECH MIRAX | .mrxs |
✅ | ✅ |
| Ventana | .bif |
✅ (patched build only) | ✅ |
| DICOM WSI | .dcm |
✅ | listed, untested (here) ¹ |
| Philips TIFF | .tiff |
✅ | ? ² |
| Philips iSyntax | .isyntax, .i2syntax |
❌ | ✅ |
| PreciPoint VMIC | .vmic |
✅ (patched build only) | ❌ |
| Leica | .scn |
✅ | ❌ |
| Sakura | .svslide |
✅ | ❌ |
| Trestle | .tif |
✅ | ? ² |
| Zeiss | .czi |
❌ | ✅ |
| Olympus / Evident | .vsi, .ets |
❌ | ✅ |
| Akoya / PerkinElmer | .qptiff |
❌ | ✅ |
| OME-TIFF | .ome.tif, .ome.tiff |
❌ | ✅ |
| OME-Zarr / Zarr | .ome.zarr, .zarr |
❌ | ✅ |
| Generic tiled TIFF | .tif, .tiff |
✅ | ✅ |
¹ FastSlide lists .dcm among its extensions; DICOM support has not been
verified here, so prefer OpenSlide for DICOM. ² FastSlide accepts .tif /
.tiff files, but whether it understands these vendor layouts is not documented.
Tiles are read concurrently: both backends release the GIL while decoding, so
TileGenerator(num_threads=...) scales almost linearly. The default is
min(8, CPUs - 1), counting only the CPUs the process may use (container or
taskset limits), so one CPU is always left for the rest of the program. Tiles
still come out in order and at most 2 * num_threads are held at once.
TilingResult.iter_tiles and save_tiles take the same num_threads
argument. FastSlide gets a 64 MB per-slide tile cache, as OpenSlide has by
default.
Override the default for every generator without changing code (an explicit
num_threads= still wins):
export PATCHOLOGY_NUM_THREADS=4With a PyTorch DataLoader, the threads and the workers do not compete: the
DataLoader reads tiles through indexing (gen[i]), which reads one tile per
call and starts no threads, so parallelism comes only from num_workers. Set
num_workers to about CPUs - 1 there. Threads are used only when you iterate the
generator (for tile in gen) or call save_tiles. If you do that inside each
DataLoader worker (e.g. an IterableDataset), set PATCHOLOGY_NUM_THREADS=1
(or pass num_threads=1) so workers × threads does not exceed your CPUs.
Two H&E Aperio slides (names withheld), median of 3 runs, each in a fresh process with the file already in the OS cache: open the slide, detect tissue and build the tile grid, then read every 224 px tile at 0.5 µm/px with colour processing off. Peak is the run's resident memory high-water mark. Intel Core Ultra 7 265K (20 cores).
| Slide | Backend | Threads | Tiles | Open | Tissue + grid | Read all tiles | Tiles/s | Peak memory |
|---|---|---|---|---|---|---|---|---|
| A (636 MB, 55775 × 55544) | OpenSlide | 1 | 1704 | 16 ms | 0.37 s | 6.21 s | 274 | 234 MB |
| A | OpenSlide | 8 | 1704 | 16 ms | 0.38 s | 0.86 s | 1971 | 234 MB |
| A | FastSlide | 1 | 1715 | 7 ms | 0.23 s | 3.47 s | 494 | 238 MB |
| A | FastSlide | 8 | 1715 | 8 ms | 0.23 s | 0.50 s | 3460 | 238 MB |
| B (54 MB, 23904 × 27759) | OpenSlide | 1 | 2806 | 13 ms | 0.22 s | 8.69 s | 323 | 166 MB |
| B | OpenSlide | 8 | 2806 | 12 ms | 0.22 s | 2.51 s | 1118 | 259 MB |
| B | FastSlide | 1 | 2737 | 4 ms | 0.16 s | 7.53 s | 363 | 302 MB |
| B | FastSlide | 8 | 2737 | 4 ms | 0.16 s | 2.05 s | 1337 | 317 MB |
FastSlide reads 1.1–1.8× faster than OpenSlide, and 8 threads read 3.5–7×
faster than one. Slide B is smaller and more compressed, so it gains less. With
ICC calibration and Macenko normalisation on, slide A runs at 177 (OpenSlide) and
248 (FastSlide) tiles/s on one thread and 1213 and 1735 tiles/s on eight. Tile
counts differ slightly between backends because each decodes the detection
thumbnail a little differently. Reproduce with
uv run python -m patchology.utilities.benchmark_backends slide1.svs [slide2.svs ...].
-
Tissue detection (
TissueConfig): the slide is read atthumbnail_mpp(default 8 µm/px) and HSV saturation is thresholded (triangleby default;otsu,otsu_grayandfixedare available), then closed, with small fragments removed and small holes filled. All sizes are in microns. Two grey-object rules then drop what saturation wrongly passes as tissue: dark grey markers, labels and slide edges, and light grey straight bands along glass and coverslip edges (remove_dark_objects, on by default). Their thresholds are inGreyObjectConfig; to recalibrate them for a new scanner, stain or format, see what they remove first:python -m patchology.utilities.inspect_tissue out/ slides/ --set band_max_chroma=24
It writes an overlay per slide (removed regions and near misses boxed and numbered) and
regions.csvwith each region's measurements, using the values given with--set. Then pass the values you settle on:TissueConfig(grey_objects=GreyObjectConfig(band_max_chroma=24)). -
Custom mask: pass
tissue_mask=torun()(array, PIL image,.npyor image path, orSlideMask) to replace detection. The mask may be at any resolution and is assumed to cover the whole slide. -
Artifact removal (
ArtifactConfig): pen ink (blue, green, black; red is opt-in) is detected on the thumbnail. Blur detection (opt-in, slower) scores focus on 128 µm cells atblur_mppas Laplacian variance relative to intensity variance, over stained pixels only. Artifacts are removed from custom masks too; setpen=Falseto keep a mask as is. -
Tiling (
TilingConfig):tile_sizeis in output pixels attile_mpp.tile_overlapis the fraction by which neighbouring tiles overlap (default 0; 0.2 means 20%), so tiles aretile_size * (1 - tile_overlap)apart.grid="hex"places tile centres on a hexagonal lattice, so each tile has six neighbours at that distance. A tile is kept if at leasttissue_overlap(default 0.1, i.e. 10%) of its area overlaps tissue. Coordinates are level-0 top-left corners. -
Colour (
ColorConfig): tiles read throughread_tile/iter_tilesare optionally converted from the slide's embedded ICC profile to sRGB (icc=True; off by default; slides without a profile are unchanged), then optionally stain normalised with Macenko (stain_normalization="macenko"). The slide's stains are estimated once fromstain_sample_tilesselected tiles and mapped tostain_target: the classic Macenko reference vectors (REFERENCE_STAINS) by default, or your own reference as an image path, PIL image, uint8 RGB array,Stains, or a.jsonfile of saved stains.
from patchology import ColorConfig, TilingPipeline

pipeline = TilingPipeline(color=ColorConfig(stain_normalization="macenko"))
pipeline = TilingPipeline(
    color=ColorConfig(stain_normalization="macenko", stain_target="my_reference.png")
)Scanners store pixels in their own colour space and record it as an embedded
ICC profile. ICC calibration (ColorConfig(icc=True), off by default)
converts tiles to standard sRGB, so they look as the scanner vendor intended
and match across scanners. Stain normalisation then maps the slide's
hematoxylin and eosin colours onto a target, which reduces staining
differences between labs and batches. ICC runs first, so with it on, stains
are estimated on calibrated colours.
ICC applies to tiles only. Tissue and artifact detection always run on the stored pixels, which their thresholds are tuned on: some profiles (for example on Philips iSyntax slides) map most of a slide to white, which would hide the tissue.
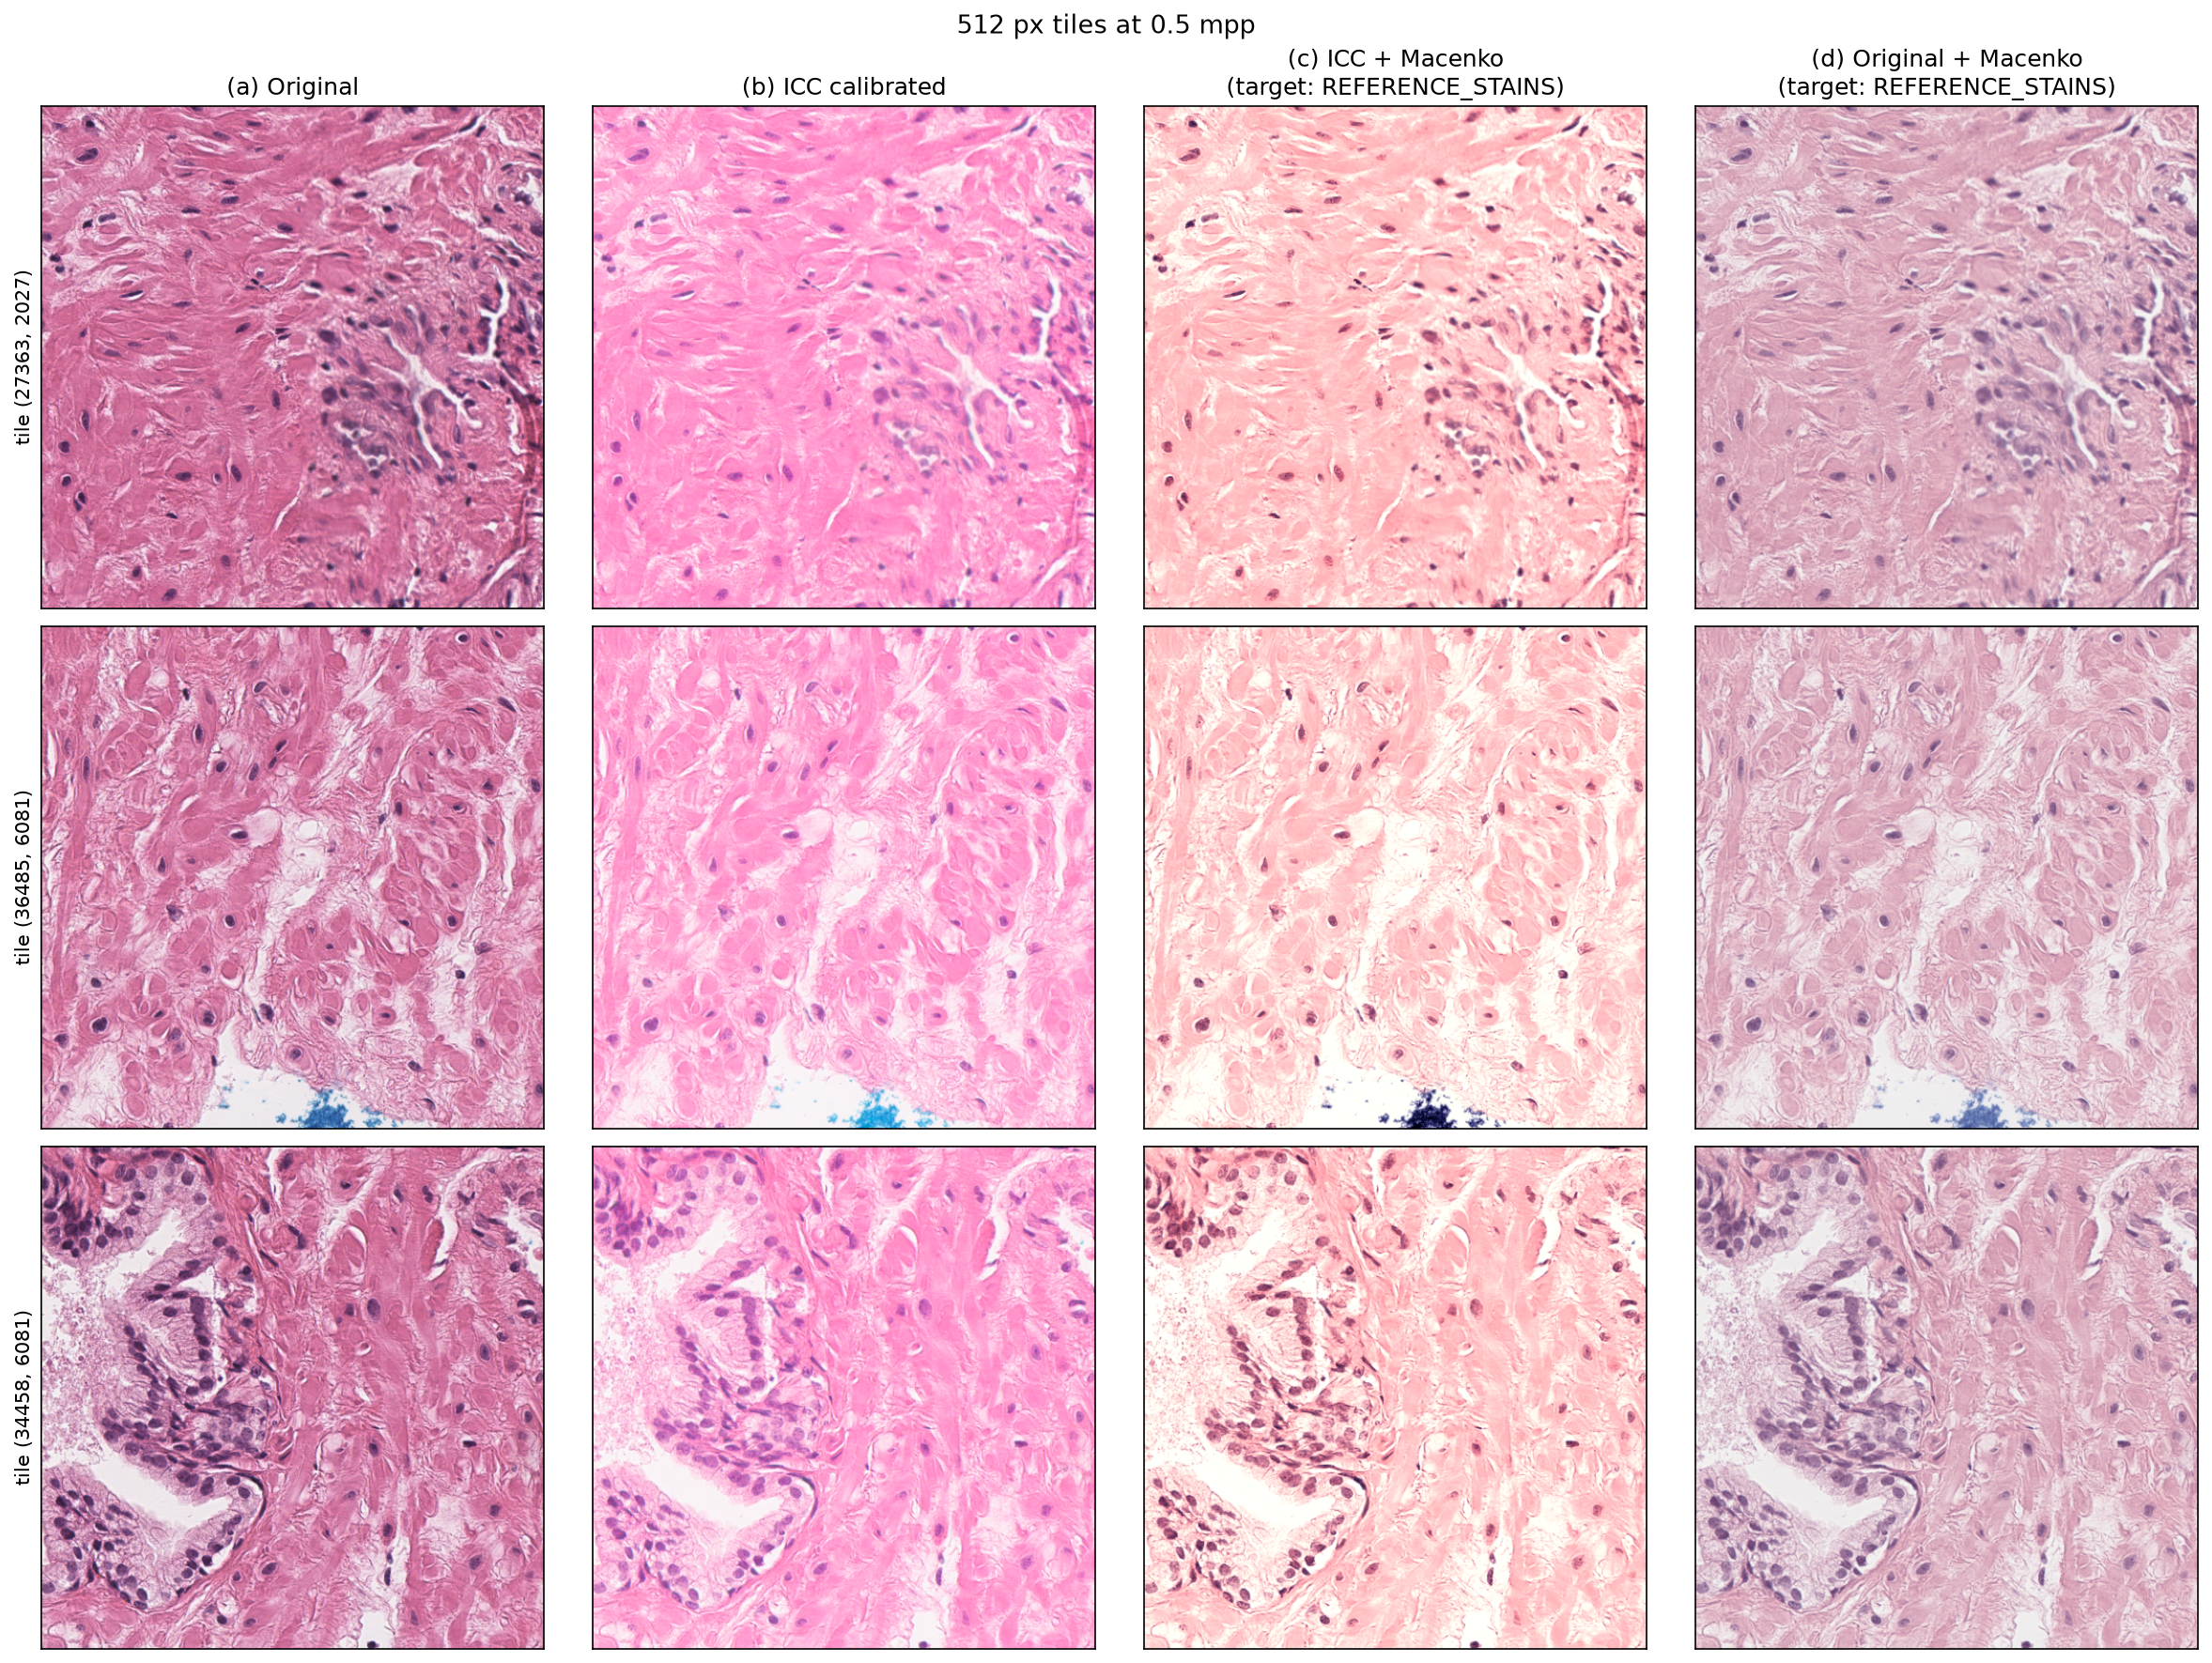 Three 512 px tiles at 0.5 µm/px: (a) as stored, (b) after ICC calibration to
sRGB, (c) after ICC and Macenko normalisation to
REFERENCE_STAINS, (d) after
Macenko normalisation alone, with stains estimated on uncalibrated colours.
The classic REFERENCE_STAINS target gives a pale eosin (as in (c)); pass
your own reference tile, e.g. stain_target="my_reference.png", to match your
data. Regenerate the figure with
uv run --with matplotlib python -m patchology.utilities.plot_color slide.svs [reference.png].
To normalise to your own cohort instead, estimate its stains from a set of
slides. estimate_stains estimates each slide's stains as tiling does, writes
their median to JSON and lists the slides furthest from it (often a wrong stain
type or a failed stain):
python -m patchology.utilities.estimate_stains cohort_stains.json slides/ --max-slides 100ColorConfig(stain_normalization="macenko", stain_target="cohort_stains.json")Pass H&E slides only (Macenko assumes two stains), and estimate with the same
icc setting you tile with (--icc for icc=True).
All functions return a PIL.Image (shown inline in Jupyter; .show() or
.save() elsewhere). Tissue is drawn in green and artifacts in red. Tiles
from a square grid are drawn as blue boxes, and tiles from a hex grid as black
hexagons centred on each tile (tile_shape= and tile_color= override this).
from patchology import visualize_result, visualize_slide

result.overlay()  # masks + tiles on the detection thumbnail
result.overlay(tiles=False)  # tissue mask only
result.overlay(tissue=False, artifacts=False)  # tile grid only
result.overlay(slide=slide, max_size=4096)  # sharper, re-read from the slide

# Any slide / mask / coordinates, e.g. reloaded from a saved run:
visualize_slide(
    slide,
    tissue_mask="out/tissue_mask.png",
    coords=coords,
    tile_size=level0_tile_size,
    max_size=2048,
)
draw_mask and draw_tiles are the numpy building blocks, for composing
your own figures.
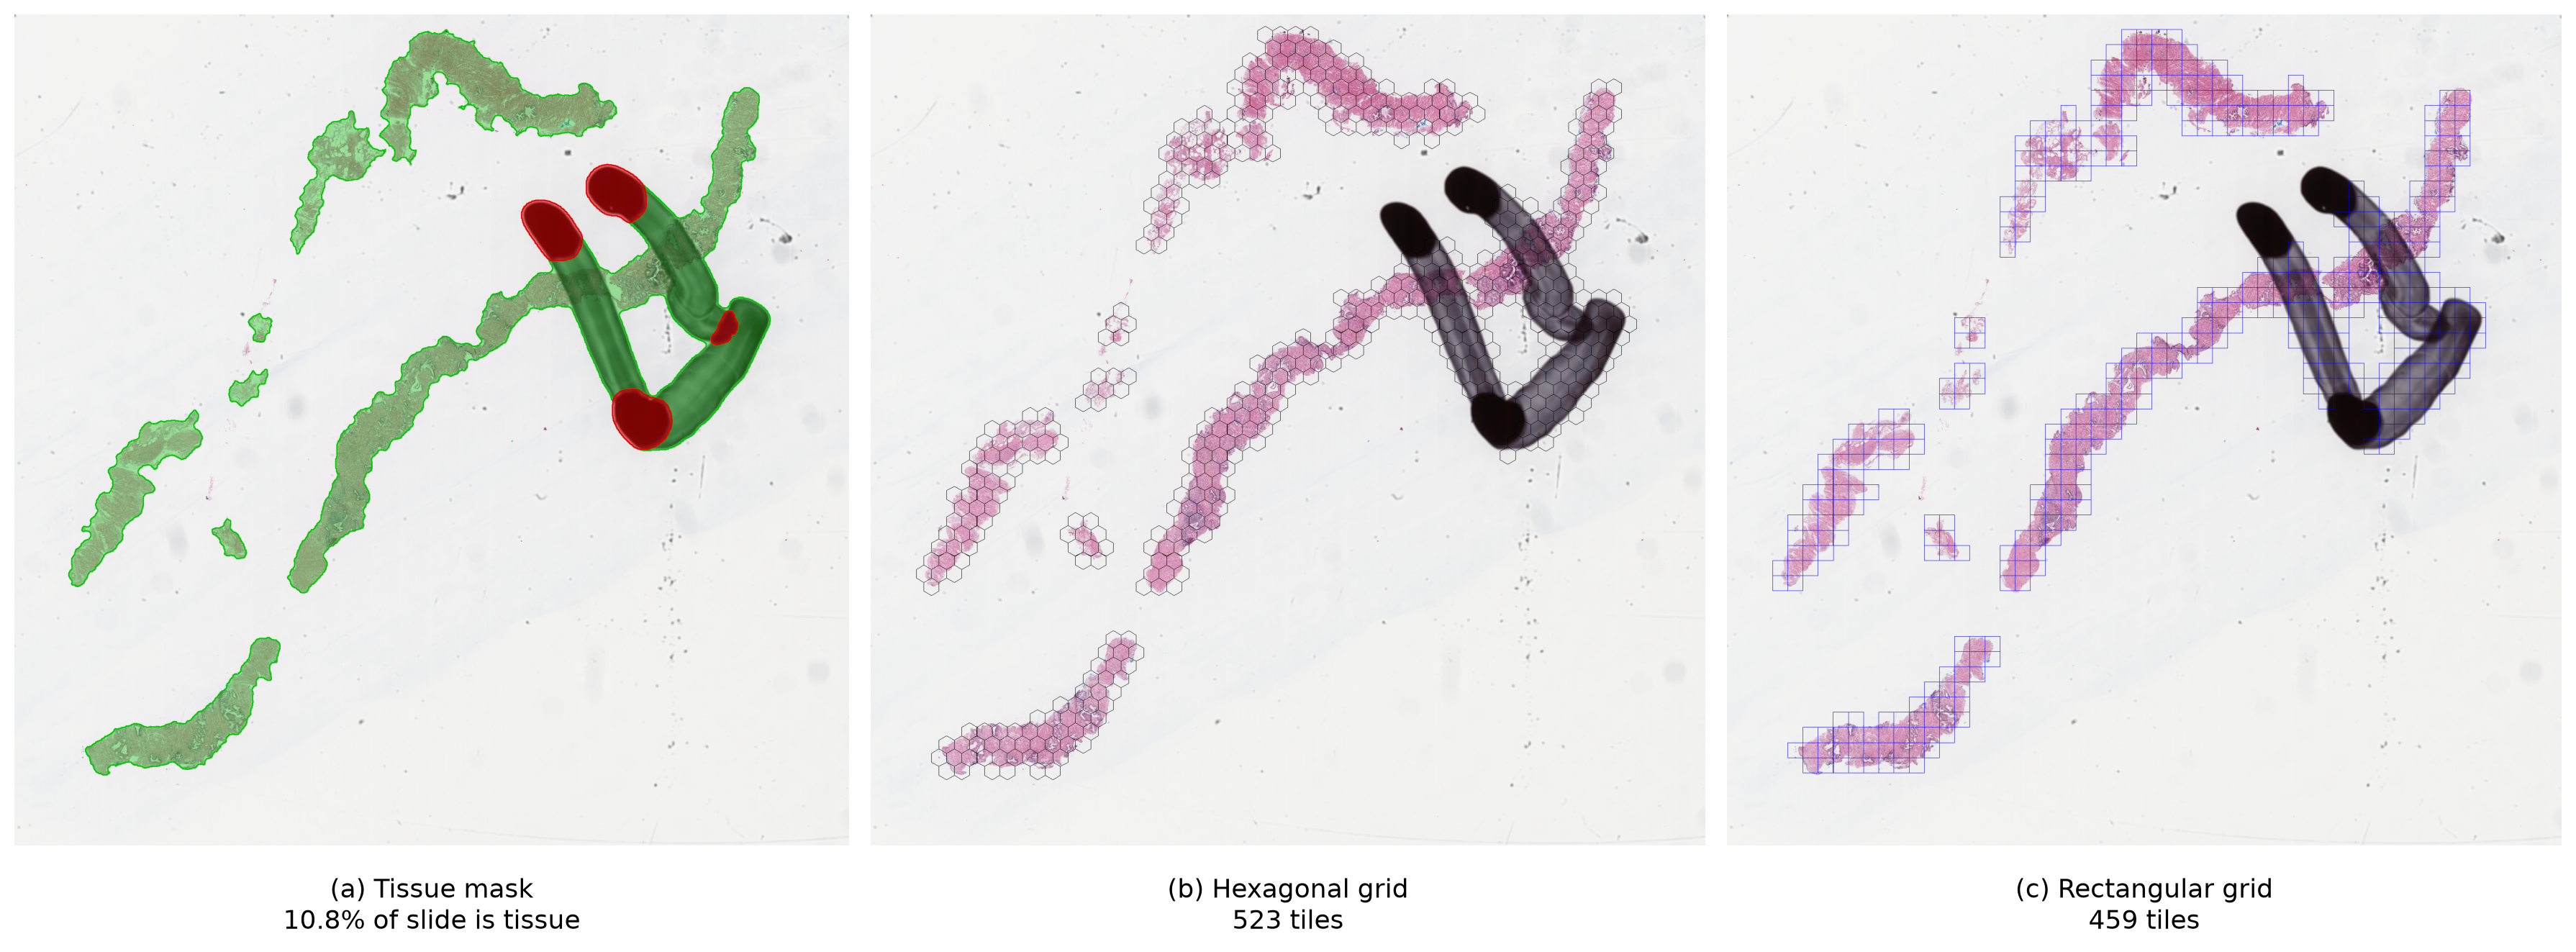 512×512 px tiles at 0.5 µm/px,
tile_overlap=0, tissue_overlap=0.1.
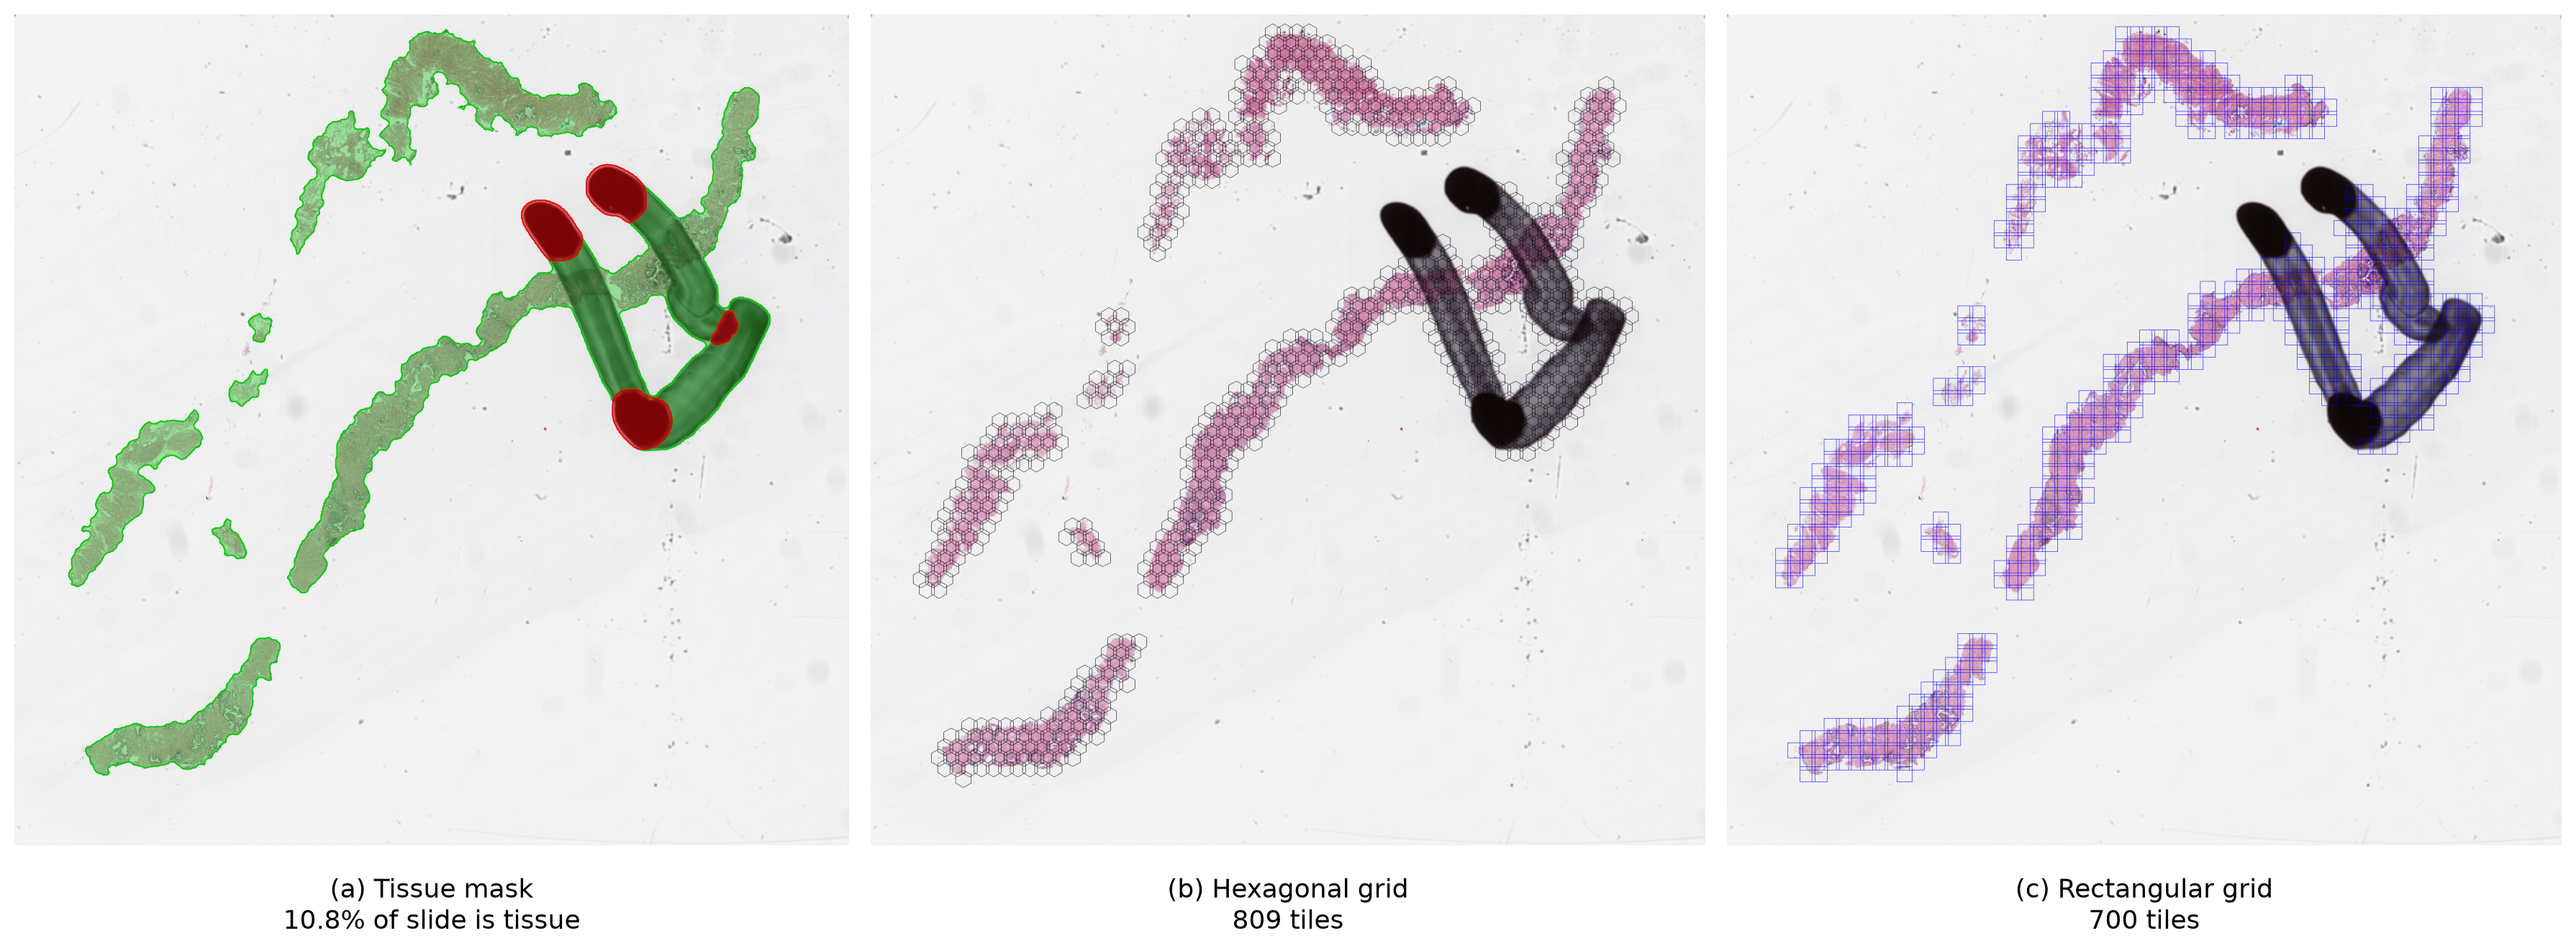 Same slide with
tile_overlap=0.2.
Logs (via loguru) show INFO and above by default. Override before running:
export PATCHOLOGY_LOG_LEVEL=DEBUG # or ALL for everything, WARNING for lessEach library in the family reads its own <PACKAGE>_LOG_LEVEL (e.g.
PATHOTRAIN_LOG_LEVEL), so levels are set per library in any import order. If
your application configures loguru itself (removes the default handler before
importing patchology), that setup is left untouched.
uv sync
uv run pytest
# Backend conformance tests against a real slide:
PATCHOLOGY_TEST_SLIDE=/path/to/slide.svs uv run pytestpatchology builds on these projects:
- FastSlide: fast whole-slide image reader, one of the two backends.
- OpenSlide: whole-slide image reader, the other backend.
- QuPath: its GeoJSON annotation format is what patchology reads for ROIs and ground truth.
Apache License 2.0, see LICENSE. OpenSlide (installed via
openslide-bin) is LGPL-2.1 and is used as a separate library; FastSlide is
Apache-2.0.